
| [Home] |
|
| Products | Neurofeedback Software | Target Group | Language |
| |
|
|
|
| eBioo® |
|
Trainer Home Trainer |
en / de |
| pronounced as: [ˌebi ˈjuː] | The Neurofeedback Software eBioo ® was designed and published by the company holder of Soft-dynamics.de since 2007. In particular Neurofeedback Software was created to have the following properties: |
|
|

(See larger picture) |
- e.g. coherence as real time spectrum chart |
|
|
 4 Channel Unit |
|
|
|
| |
|
|
|
| eBioo | Program Description | |

|
Introduction:
The software offers 3 basic operating modes:
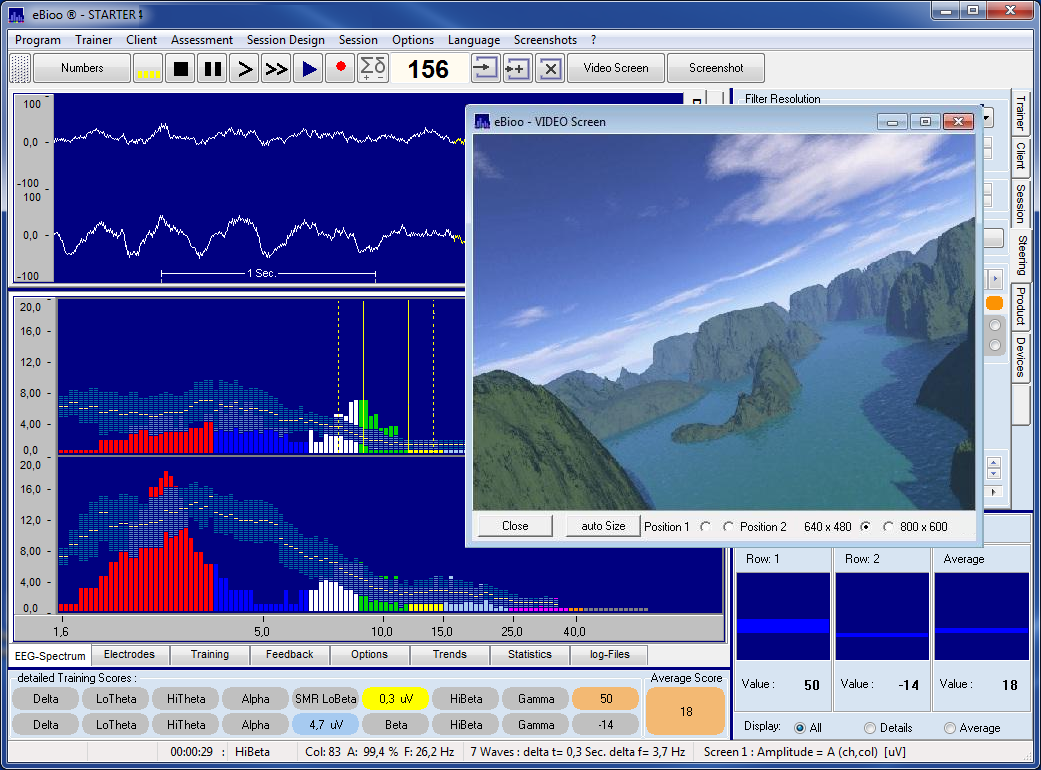
As basic version, eBioo-Software (eBioo - Brainwave Tuner) is a 2 channel 16 bit version. The Software offers a set of training functions, such as: Amplitude, relative Amplitude, Asymmetry, Coherence, Peak Frequency, Phase Synchrony and more, that can be configured as display function and for training feedback evaluation as well. The training filter can be modified 'on-the-fly' while training. After defining a reward ratio, the reward threshold is self-adjusting. The filter frequency borders and frequency uncertainty can be displayed on screen in a WYSIWYG kind. For training, one single function or different functions with different frequency ranges can be configured in combination. The current amplitude spectrum is displayed on screen together with a probability amplitude band. (see Statistics evaluation) The spectrum screen, the visible filter borders and the probability amplitude band allows to fine adjust the training parameters and strategy while training. The software is prepared and tested to process (in a pro version) up to 8 channels simultaneously. The program is currently designed for two languages: English and German. The language of display items can be changed at any time even while running the program, using menu option 'Language'.
Screen layout:
The Training Design can be defined in folder 'Training'. |
|
| See also: Functionality in eBioo Data Sheet | |
|
| |
||
| eBioo | Training- & Display Functions | |
| |
 eBioo: Trend-Screen of selected Bands or Functions |
|
| |
|
|

|
Amplitude: The amplitude as maximal deflection of an oscillation, is depicted in micro Volt (uV) and is evaluated in eBioo as 'spectral density'. The amplitude range can be scaled and the frequency range can be defined by the user as well.
The frequency uncertainty (selectivity) of a filter is determined
by the number of waves, that are used to evaluate the amplitudes.
The more waves for the amplitude calculation are used, the greater the
frequency selectivity is - but necessarily also the average temporal delay
that has to be considered until the feedback signal can appear.
(Example: 10 Waves of a 10 Hz oscillation have a duration of 1.0 second;
the average delay to be considered then is 0.5 seconds)
In neurofeedback programs, the frequency selectivity is determined
indirectly choosing the filter order. In eBioo the number of waves can be selected directly. (See folder 'Steering', Panel: FT-Resolution)
Yellow line: Statistical median Amplitude
|
|
| Neurofeedback Amplitude See larger image | |
|
| |
|
|

|
relative Amplitude: The relative amplitude is evaluated, comparing the amplitude of a particular frequency with the current average amplitude of the frequency range that goes from from Theta up to Beta. ( rel.A := A/[A] ) The relative amplitude thus has in general a mean value of 1.0 and a range of about 0.5 up to about 2.5 .
Temporal amplitude changes (e.g. turbulences) thus do not have that effect
using training method 'relative amplitude', as if training method amplitude
is used alone or instead. Compare: training method 'Amplitude promote'
rewards turbulences as well.
With training method 'relative Amplitude' more or less the structure
of an amplitude distribution is rewarded rather than an amplitude alone.
In eBioo Training method 'relative Amplitude'
can be used in combination with training method 'Amplitude'.
Yellow line: Statistical median Value
Mid blue Band: 50% probability range of the amplitudes (see also chapter: Statistical Evaluation )
|
|
| Neurofeedback relative Amplitude See larger image | |
|
| |
|
|

|
Coherence: The coherence is provided in eBioo frequency dependent in the spectrum screen with value range from 0.0 to 1.00 (commonly expressed as 0 - 100%) and is selectable as training method as well.
In eBioo, the frequency range for coherence training
is not limited to a defined frequency band but can be adjusted in the training
screen with an accuracy of 0.5 Hz and modified even while training.
Simultaneously the coherence can be observed in the spectrum screen.
Yellow line: Statistical median Value
|
|
| Neurofeedback Coherence See larger image | |
|
| |
|
|

|
Phase Difference:
The phase difference is given and depicted in degree and has in eBioo a range
from -180 to +180 degrees.
The current phase difference between channel 1 and 2 is depicted as dotted line in real time.
That way phase shifts are visible.
In eBioo, values of function 'phase difference' are not depicted as bars.
Only the bar peaks are displayed. That is, to assure that in case of an increase of a value
beyond 180 degrees, there is no visible bar that swaps from positive to negative direction,
what would optically be crucial in readability.
Values between 180 and 360 degree are displayed in the ranger of -180 up to 0 degrees. That way
a phase difference of 181 degree is identical to a phase difference of -179 degree
( -179 = 181 - 360 degree ).
The mid-blue Band of the 50% probability range is measured in the example
(see: preview image on the left) in the entire frequency range (except Delta)
between +35 and -20 degrees. The dotted line shows a momentary phase shift.
|
|
| Display Modes | Functions 
|
Display Modes and -Functions: The spectrum layout can be modified and for every channel the function to be depicted can be selected individually. To switch between these display functions, a click onto the appropriate spectrum screen using the right mouse button will let pop up a menu to select the requested display mode and function. |
|
| Neurofeedback Phase Difference See larger image | |
|
| |
|
|
| eBioo Manual |
 (Read or Download a preview |
|


| |
|
|
|
|||||||||||
To configure the training parameters 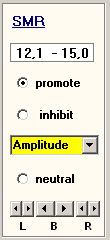
See complete Training Design Panel in larger image |
Training functions are: |
|||||||||||||
|
||||||||||||||
|
||||||||||||||
| |
|
|
|
| eBioo | Training Design | |
|
| |
|||
|
|
Configuring a Training Design: In many software products that are available on the market, training concepts have to be designed on a design form or one or even more mathematical functions have to be entered into a "Wizard". The effort to figure out a concept, design and test a new client specific design exceeds often one working hour. Furthermore these designs are static and can hardly be changed during the training session. To configure a comparable training design in eBioo requires often not more than 2 or 3 minutes of time. In eBioo only the following has to be done: Selection of the data channels, selection of training functions and selection of the corresponding frequency ranges. Several different trainings functions and different frequency ranges can of cause be combined in the same training design and session and can be optimized during the ongoing training session. The high resolution spectrum screen gives helpful hints to optimize the parameters. |
|
|
| For enhanced display with monitor resolution 1024 x 768 click here. |
Training Design Switchboard To configure a training design there are two rows of 8 Filters for each row. The frequency interval, the training direction (promote or inhibit) and the evaluation function (amplitude, relative amplitude, asymmetry etc....) can be chosen for each Filter individually. A filter is assigned to one or more channels. The training parameters can be modified 'on-the-Fly' during training session (even if data processing is running) to evaluate the reward feedback level and feedback. |
|
|
| |
|||
| |
Training and Feedback Signal:
For the feedback evaluation there are (see folder:
'Training') 2 rows of 8 configurable filter (frequency windows).
With these filters the requested frequency range, training
direction (e.g. 'promote', 'inhibit' or 'neutral' = inactive ) and
output function (e.g. amplitude) can be selected.
In the represented example the filter 1.4 and 2.1 are switched
active (here for: Alpha promote and LoTheta inhibit).
The score value of each row is evaluated separately and can be linked
with a different feedback signal as well as to a common feedback signal. |
|
|
| eBioo® | Functionality | |
|
| |
|
|
|
| |
Special Features of eBioo®:
Configuring a training protocol, different output functions and training filter parameters (such as e.g. Amplitude, relative Amplitude or Asymmetry) may be combined within the same training design and session. Due to a program internal normalizing logic, different functions can be combined in one training design even if they cover very different data ranges.
The frequency axis can have linear or a logarithmic scaling. A linear scale can be selected
at any time by menu option. The output i.e. display function (e.g. Amplitude, rel.Amplitude, Band Amplitude, Asymmetry ...)
is selectable by user option. The current training score of every filter (frequency window) is displayed in
section "detailed Training Scores", together with the total training score in section "Average Score" (average of row 1 and row 2).
The frequency range of every filter (frequency window), can be defined and modified individually from the band definition.
A total score that is greater than zero will initiate a feedback response.
The mouse pointer is displayed in the frequency amplitudes screen as yellow '+' sign.
The mouse position and the according values are provided in the status bar
(see bottom line of the screen) .
Delimitation: The displayed values are considered to be estimations
and not to be accurate values. The A:-%-value is a relative value
compared to a the maximum scale value (here: 25 uV).
The "delta t" value is an estimation of the time interval for
each individual frequency transformation, based for the determination of
the amplitude of each frequency bar.
The "delta t" value then is also a measure for an (in general) unwanted temporal delay of
the feedback signal relative to changes of the raw signal.
The length of this average time interval i.e. delay is configurable.
The current amplitude values are represented in the amplitude display screen
as light blue bars.
The shadowed area in mid blue color represents the amplitude fluctuation
of the preceding time interval of (in this example) 52 seconds
as A.25 and/or A.75-Amplitude value. The A.75-Amplitude was defined as
the amplitude below those 75% of all amplitude values of the last time
interval of (here) 52 seconds have been observed.
For this statistics evaluation, the amplitude is checked 20 times a second.
Thus it is possible to receive and display quantitative
statements simultaneously about amplitude average values and their deviation range as
well as the amplitude distribution curve with a frequency resolution of
0.5 Hz. |
|
|
| |
You can download the eBioo STARTER Kit Software at the Download Page.
to download the eBioo STARTER Kit Software now |
|
| [Main Menu] |
|
|